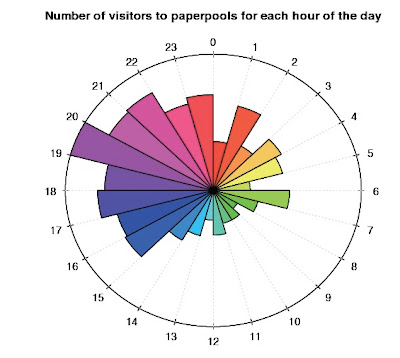
This isn't terribly informative (FAQ: Just how many visits is this website getting, anyway? FR [frequent reply]: Hollow laugh), but shows more visitors turning up between the time most Americans have got a decent amount of caffeine into the system and the time most Americans call it a night (the clock is set to Central European time, so we see the time zones working their old familiar magic). Anyone who has spent any time with R, anyway, will understand the sense of triumph one feels on getting R to generate a plot with some of one's very own data. VZ's code is available here (you have to scroll down a bit). (What to get for the blogger who has everything...)
R can be downloaded free from any of the mirror sites here.
I woke up at 3am or so. It had rained; the air was soft and fresh. I saw that Zoonekynd had updated Statistics With R in January 2007, and had announced the new release with this Shandyesque announcement:
(In its present, sadly incomplete form the document runs to some 1085 pages.)
I have just uploaded the new version of my "Statistics with R":
http://zoonek2.free.fr/UNIX/48_R/all.html
The previous version was one year and a half old, so in spite of the fact I have not had much time to devote to it in the past two years, it might have changed quite a bit -- but it remains as incomplete as ever.
I then saw that Zoonekynd had reviewed Paul Murrell's excellent R Graphics back in 2006.
The review has the inimitable style of Zoonekynd; it also shows some of the advantages the web offers over print media. When Zoonekynd thinks Murrell has given a subject short shrift, he simply gives his own example, including a page of code and a colour illustration; it's hard to imagine any review allowing a reviewer that kind of space, let alone stretching to colour (Murrell didn't have colour graphics in the actual book, though control of colour is, of course, one of the strengths of R). Since the review is online, the reader can also copy out the new code -- this is obviously an enormous convenience which paper-and-ink reviews can't offer. When Zoonekynd thinks Murrell has something especially good to offer -- for instance, an entire chapter devoted to the creation from scratch of an oceanographic plot, whose elements are then used in an entirely different plot -- he is able to "quote" the graphics that make this so attractive. The reader doesn't have to take Z's word for it that this is interesting -- yet inclusion of graphics is again something most print reviews would be very unlikely to accommodate.
Readers who have looked at glamorous graphics among the R packages may feel that R is spiritually akin to Blue Peter. ("Here's one we made earlier," says the presenter of this notorious British children's show, gesturing airily at a suit of chain mail constructed out of ring pulls off soft drink cans.) They are likely to take heart at Zoonekynd's dogged attempts to master the program. Z:
Fonts in R, especially with non-latin1 character sets, are a nightmare -- and the 4-page section devoted to them is neither helpful nor even confident... From time to time, there is an article in RNews that explains how to use one more font, but I always fail to jump to the ceiling screaming "this finally became easy" -- I even fail to think "everything's possible", as I used to in my (La)TeX days...
You probably all know that it is possible to add to plots, not only text, but actual mathematical formulas, with greek letters or square roots, but never actually managed to do it: the book clearly explains how to use the expression() and substitute() functions to achieve this. For a finer layout, they can be combined with the strheight(), strwidth(), grobHeight(), grobWidth() functions.
These are the joys.
Ah. Looking around VZ's blog, I discover an earlier post covering the R Conference in Vienna last year. Zoonekynd summarises one session as follows:
R on Windows and MacOSX
The first speaker tried to convince us that using R on Windows, installing packages from source or even writing you own R packages on Windows was not difficult. He almost made his point: he only needed one slide to list the prerequisite software (not mentioning how to install them and forgetting about the incompatibilities with other already installed software) and two more slides to explain how to install a package (targeted at advanced Windows users: he tells to change environment variables without reminding us how) -- a stark contrast with similar explanations for a Unix platform where, if you do not understand, you simply copy and paste the instructions.
He also noted that using Windows instead of Linux "only" reduced the speed by 10% -- which is even more impressive if you consider that 64-bit R on Linux no longer runs slower that 32-bit R on Linux.
However, his talk was followed by a similar talk, that tried to do the same thing on MacOSX: the differences are amazing (the only instruction is "do not forget to install R"; R is well integrated with other MacOSX applications).
The moral of which would appear to be that Macheads who would like a clock plot of their web statistics need to remember to install R, but Windows users proceed at their peril.
No comments:
Post a Comment